
The Cost of Entertaining the World?
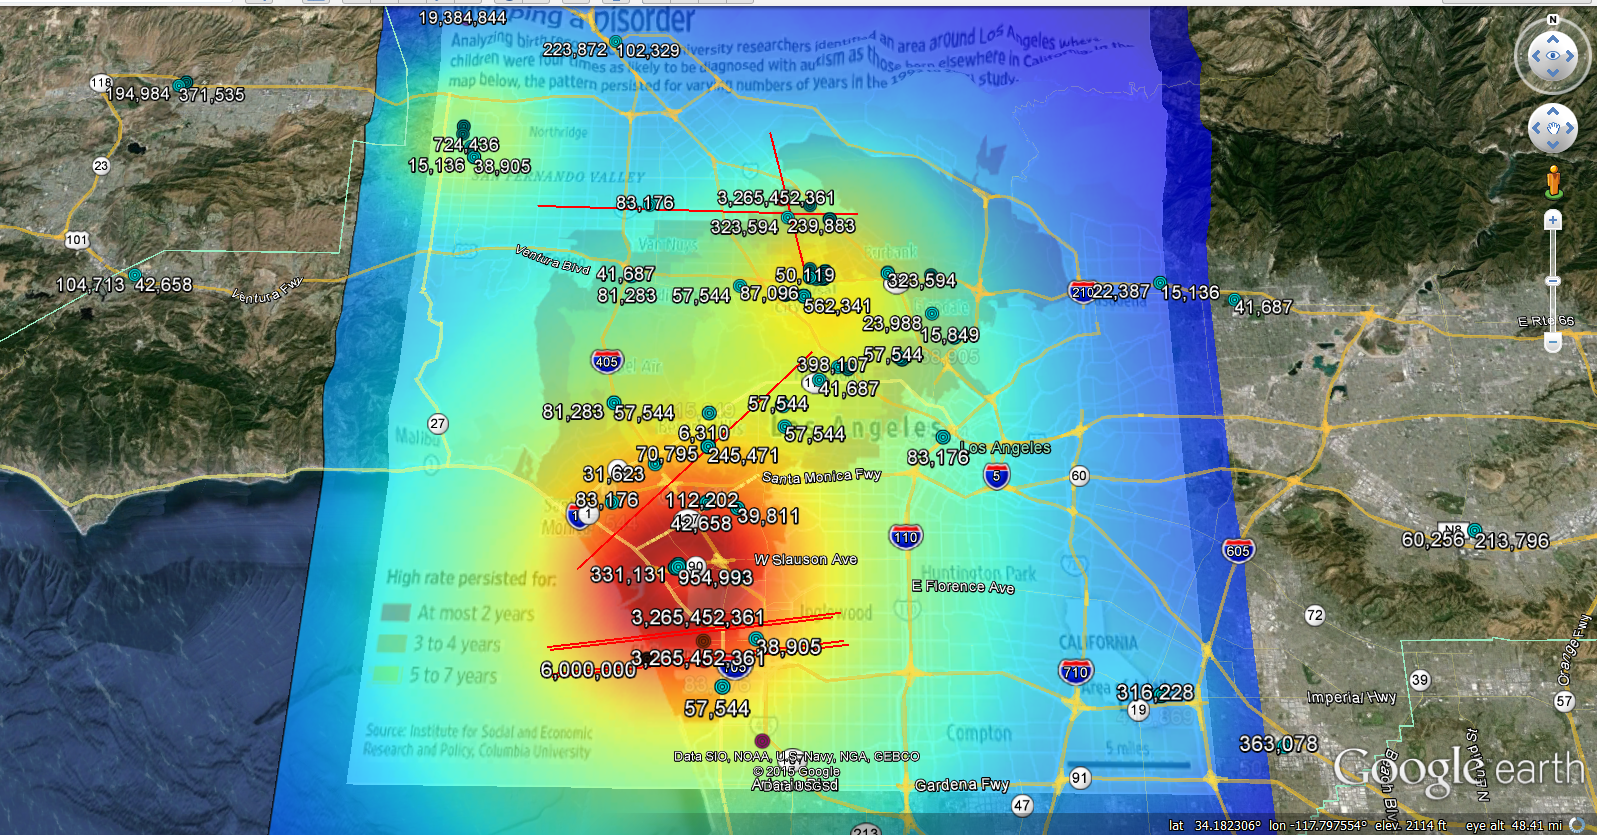
LA Autism Cluster Map Compliments Columbia University. For this radiation power map I used 3000 ft average height for reflection/refraction of microwave radiation. For pulsed radars I used average power (Peak Power x Duty Cycle). There is a higher density of microwave earthstations North of LA airport so that area has the highest power density (red). Radiation model does not account for higher elevation (shorter distance for radiation to bounce back to earth) which should increase radiation power density in the hillsides/higher elevations. There are 257 high gain microwave broadcast earthstations and high power, high gain pulsed microwave radars in the area of the box.
Conclusion: The autism cluster lines up well with the highest microwave radiation power density in the atmosphere and near busy airports. My recommendation is that all of the companies that own those microwave earthstations and pulsed radars should fund a study to make sure the increased reflected/refracted radiation from their antennas in the area is not increasing autism rates to 400% above the other areas. And they should do it fast.
Map Source Here (Wall Street Journal and Columbia University)
You can download my microwave database for Google Earth here
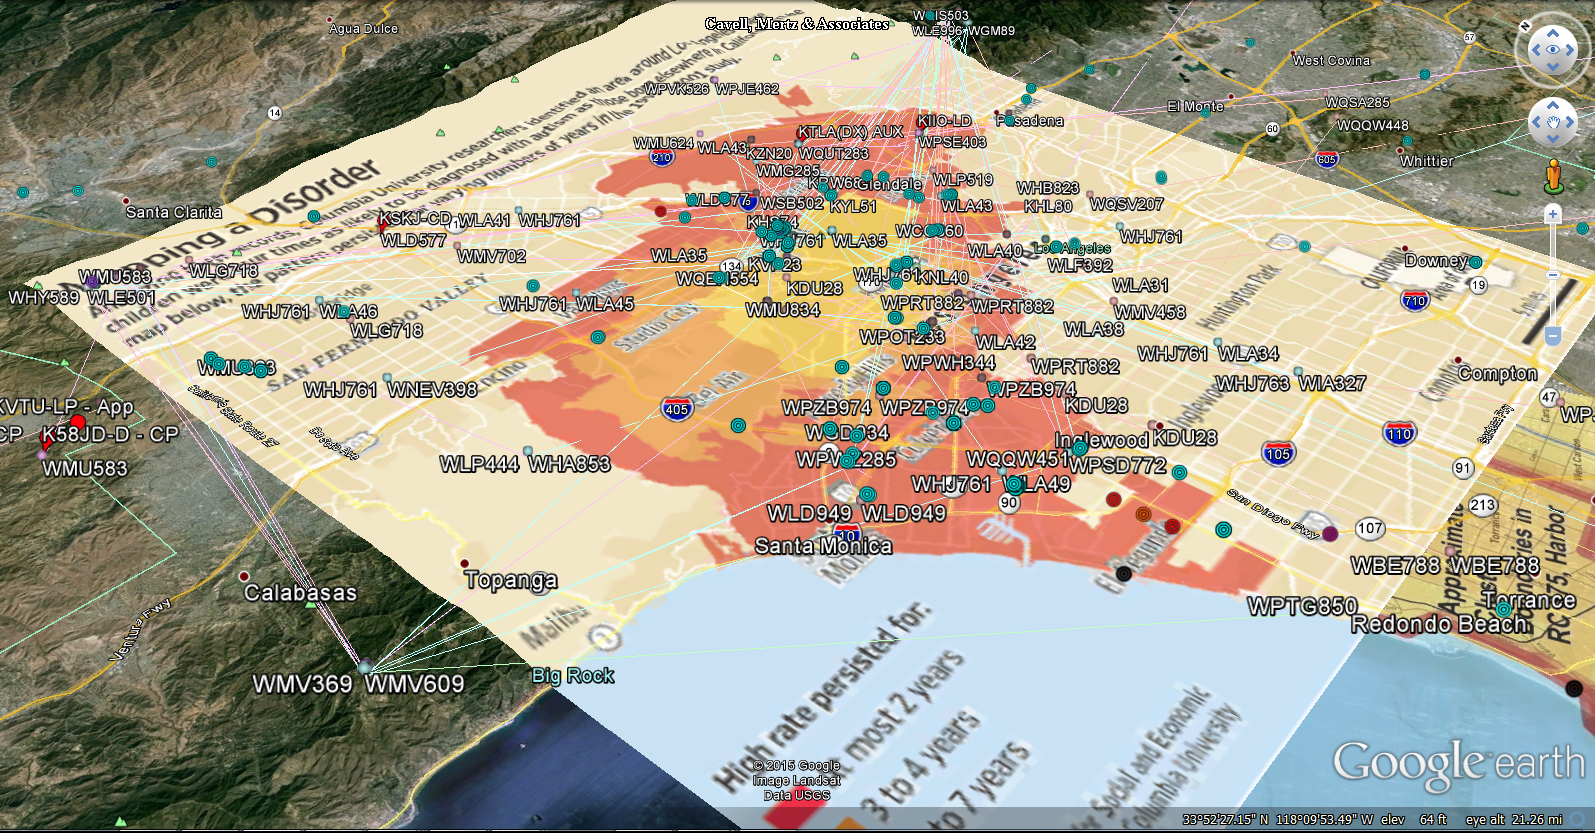
LA Autism Cluster, microwave earthstations(blue), pulsed microwave radars(red), and microwave relay towers (small silver balls with lines)
Solution to reduce autism and pollution: Move all high gain radars and microwave broadcast earthstations to the location of the garbage heap in the deep pacific ocean and irradiate the garbage.


