
Intense
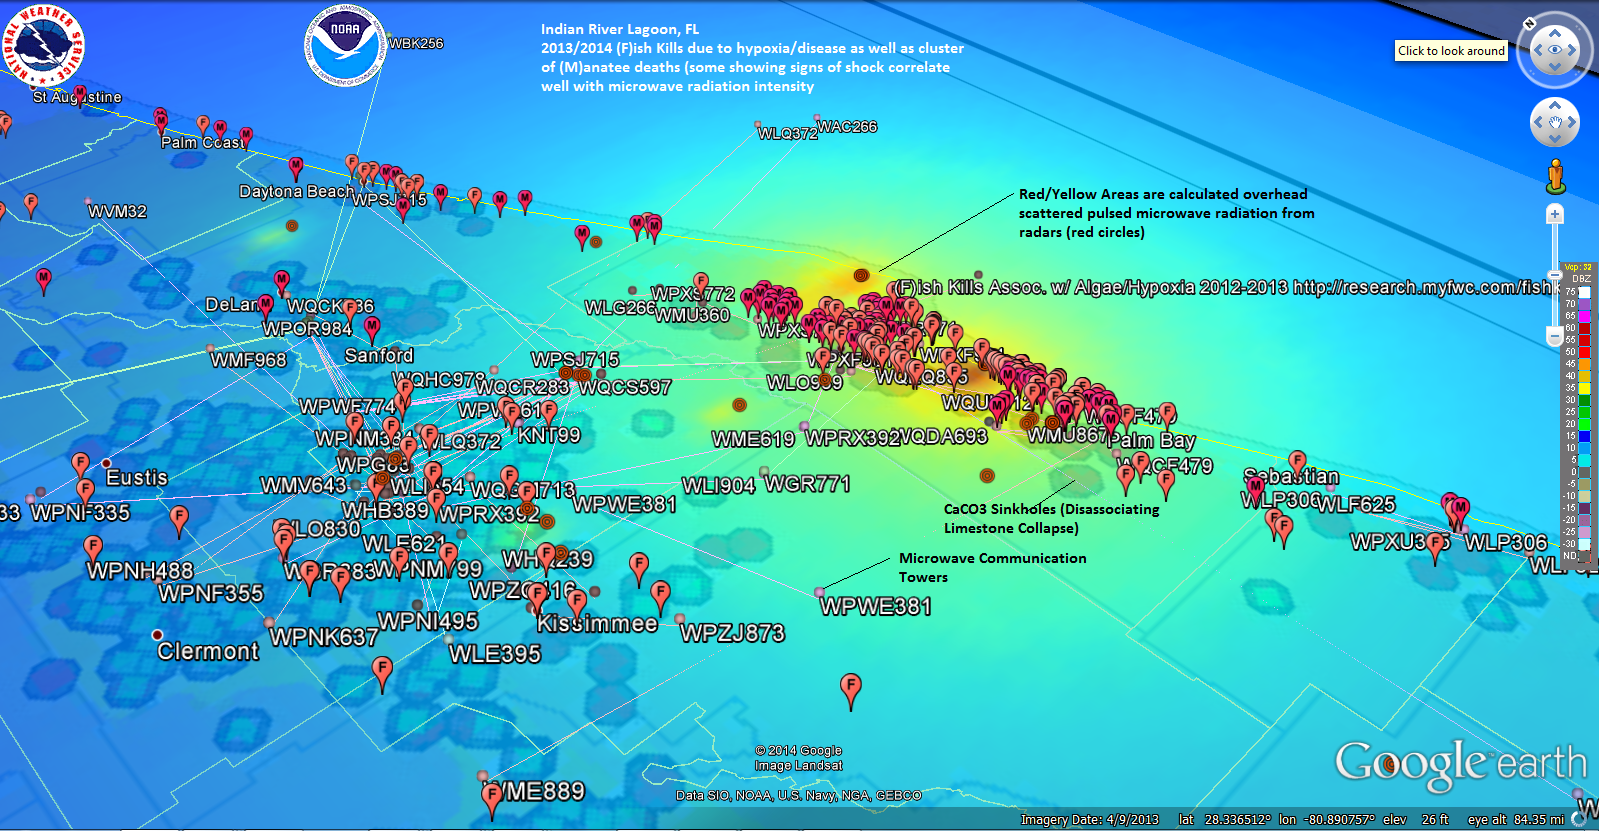
The shaded yellow area is a calculated power density (watts/sq. meter) of pulsed microwave radiation from the radars in the area. I am using Python Matplotlib to generate the Gaussian power density graphics overlay for Google Earth. There are approx 17 high power, high gain radars in the area based upon the location of the sinkholes and fish kills, I think the radiation from the microwave communication towers may also be causing a problem.
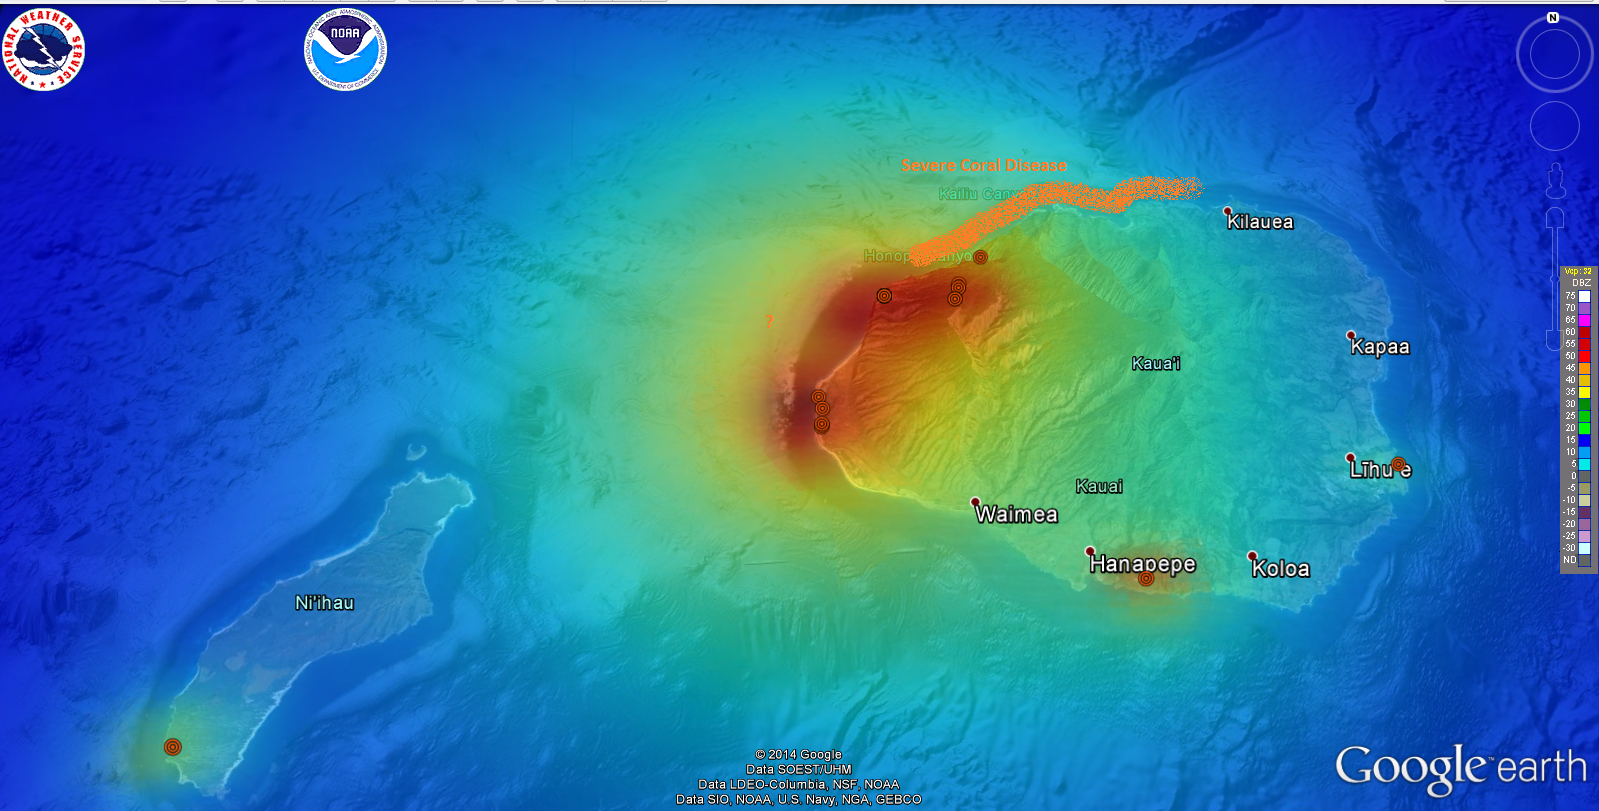
Kauai, HI Pulsed Microwave Radar Radiation Power Density Profile. North Shore Reefs are in extremely poor condition with disease and disassociation of Calcium Carbonate coral reef skeletons taking place. Fish are also disappearing, turning black and have tumors.
“Father, forgive them; for they do not know what they are doing.”


